Vibralizer is a music visualizer.
Simply, we visualize sonic vibrations.
Vibration + visualizer –> Vibralizer
But there’s a deeper connection…
Hey, I’m Kate. I’m one of the founders of Vibralizer. I did my PhD in birdsong evolution, where I was immersed in the power of visualizing sound. Songbirds can sing and process audio so much more rapidly than humans that we cannot physiologically detect all of the intricacies of many birds’ songs by ear alone.
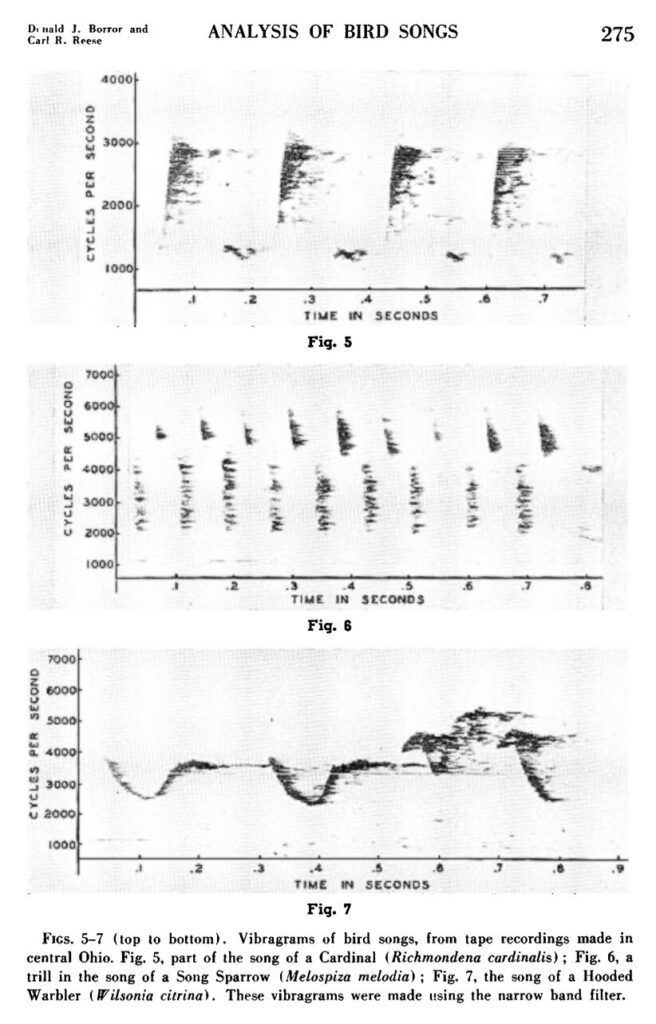
For most of human history, our understanding of birdsong was limited by the limits of human perception — until 1953, when Donald Borror and Carl Reese published a paper that translated bird songs into a format that allowed humans to appreciate their intricacies. This new technology helped launch modern quantitative analysis of birdsong.1
The format: the spectrogram (called a “vibragram” in the paper, and also sometimes called a spectrograph or sonogram)
The paper: “The analysis of bird songs by means of a ~~Vibralyzer~~”
Before spectrograms
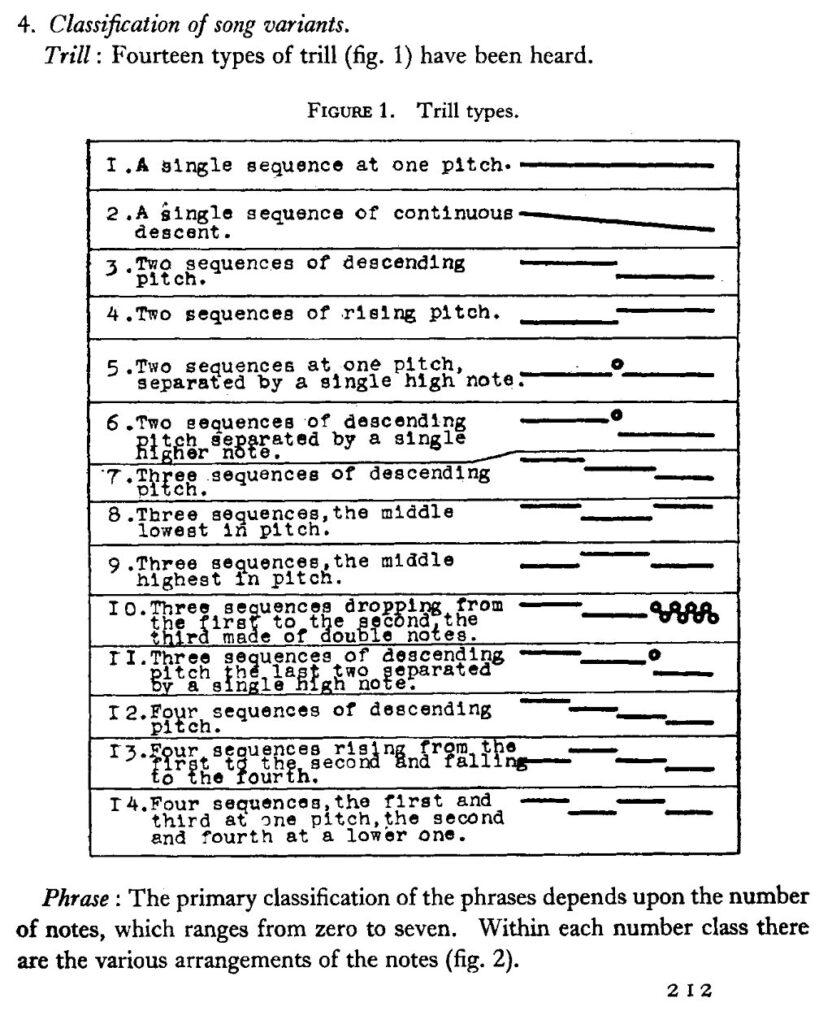
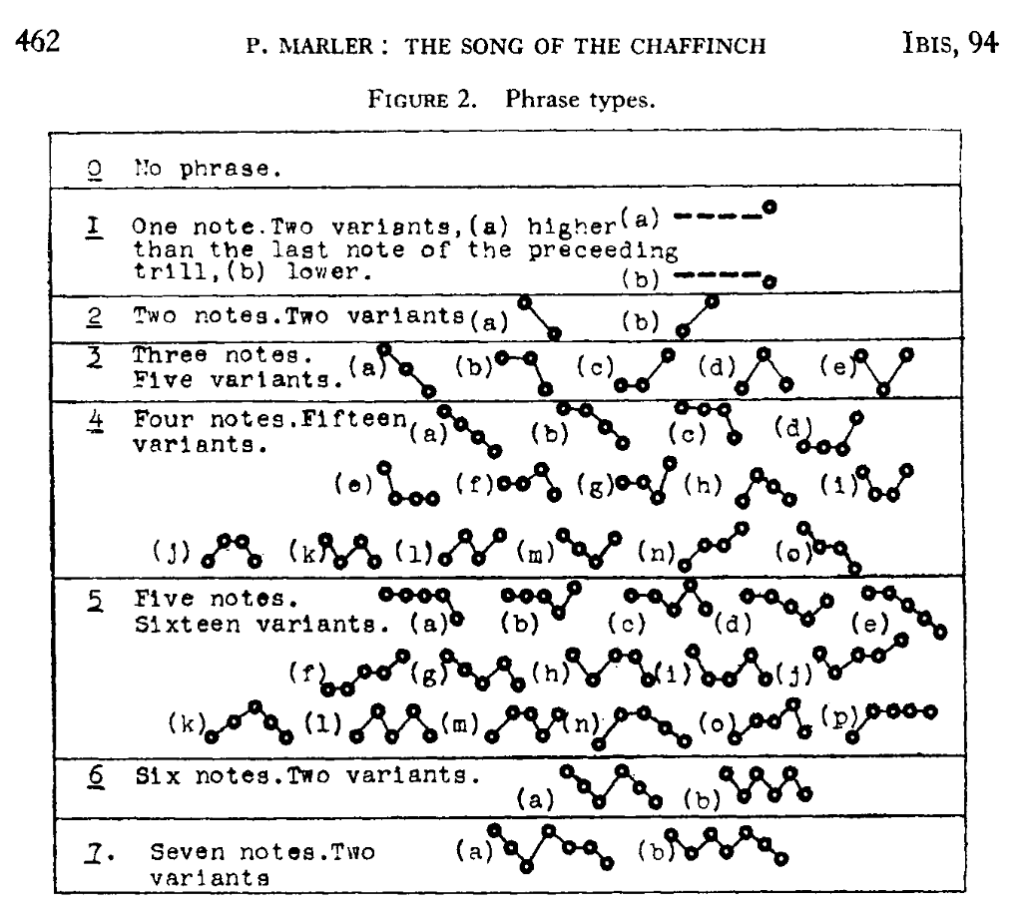
Before the use of this method for direct transcription of birdsongs, researchers could only convey song patterns based on their own ear and in very rough detail, as seen in these examples of Chaffinch songs and trills from a 1952 paper from renowned birdsong researcher Peter Marler.2
The Vibralyzer was a fully analog device that transcribed sound onto a two-dimensional graph of frequency (pitch) over time, with a third dimension, amplitude, shown as the darkness of the markings on the page.
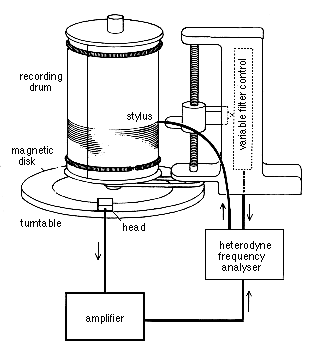
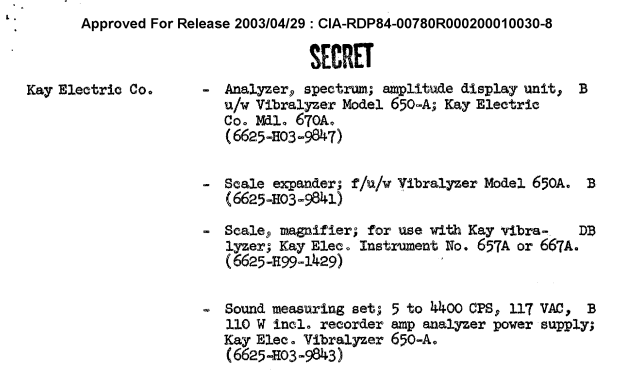
The Vibralyzer was developed during WWII for recording and analyzing acoustic signals:
ON AIRCRAFT, SHIPS, ROTATING AND RECIPROCATING MACHINERY AND IN FIELDS SUCH AS ORDNANCE, BALLISTICS, SEISMOLOGY, AND ACOUSTICS4
(Side note: while not a huge surprise, it was still pretty wild to stumble upon a declassified CIA “Standard Communications Equipment List” from 1962 with a Vibralyzer and accessories on the list!)
Donald Borror was primarily an entomologist who served in the U.S. Naval Intelligence during WWII. After the war, he returned to science and became widely known as a pioneer in the field of bioacoustics by using this war-time technology for the study of nature.5
The spectrogram plays an important role in modern life, since many sound- and speech-recognition algorithms, such as OpenAI’s Whisper6, have been trained on spectrograms. But, most people have never actually seen one.
Art + Sound + Math = Vibralizer
We believe that visualizing sound, through spectrograms and other representations, is powerful, beautiful, and enhances the way we experience music. We want to share the ability to not just hear, but see the patterns that we appreciate in music and enable deeper connections between musicians and their fans.
So, with “Vibralizer”, we’re paying homage to the avian origin of my expertise in audio analysis as well as stating our purpose: to see the vibes.
Follow along at www.vibralizer.com, or find us on socials @vibralizer.
Sources
- Donald Borror & Carl Reese (1953). “The analysis of bird songs by means of a Vibralyzer.” Source Link
- P. Marler (1952). “Variation in the song of the Chaffinch Fringilla coelebs.” Source Link
- JPROC: Sona-Graph / Sonagraph principle diagram. Source Link
- ‘United States Patent and Trademark Office (USPTO). Trademark Status & Document Retrieval (TSDR) record for “VIBRALYZER,” Serial No. 71613454, filed May 3, 1951. Source Link
- “In memoriam” for Donald J. Borror (1989). Source Link
- Radford et al (2022). “Robust Speech Recognition via Large-Scale Weak Supervision” Source Link